

How to Add Social Media Icons to an Email Signature
Enhance your email signature by adding social media icons. Discover step-by-step instructions to turn every email into a powerful marketing tool.
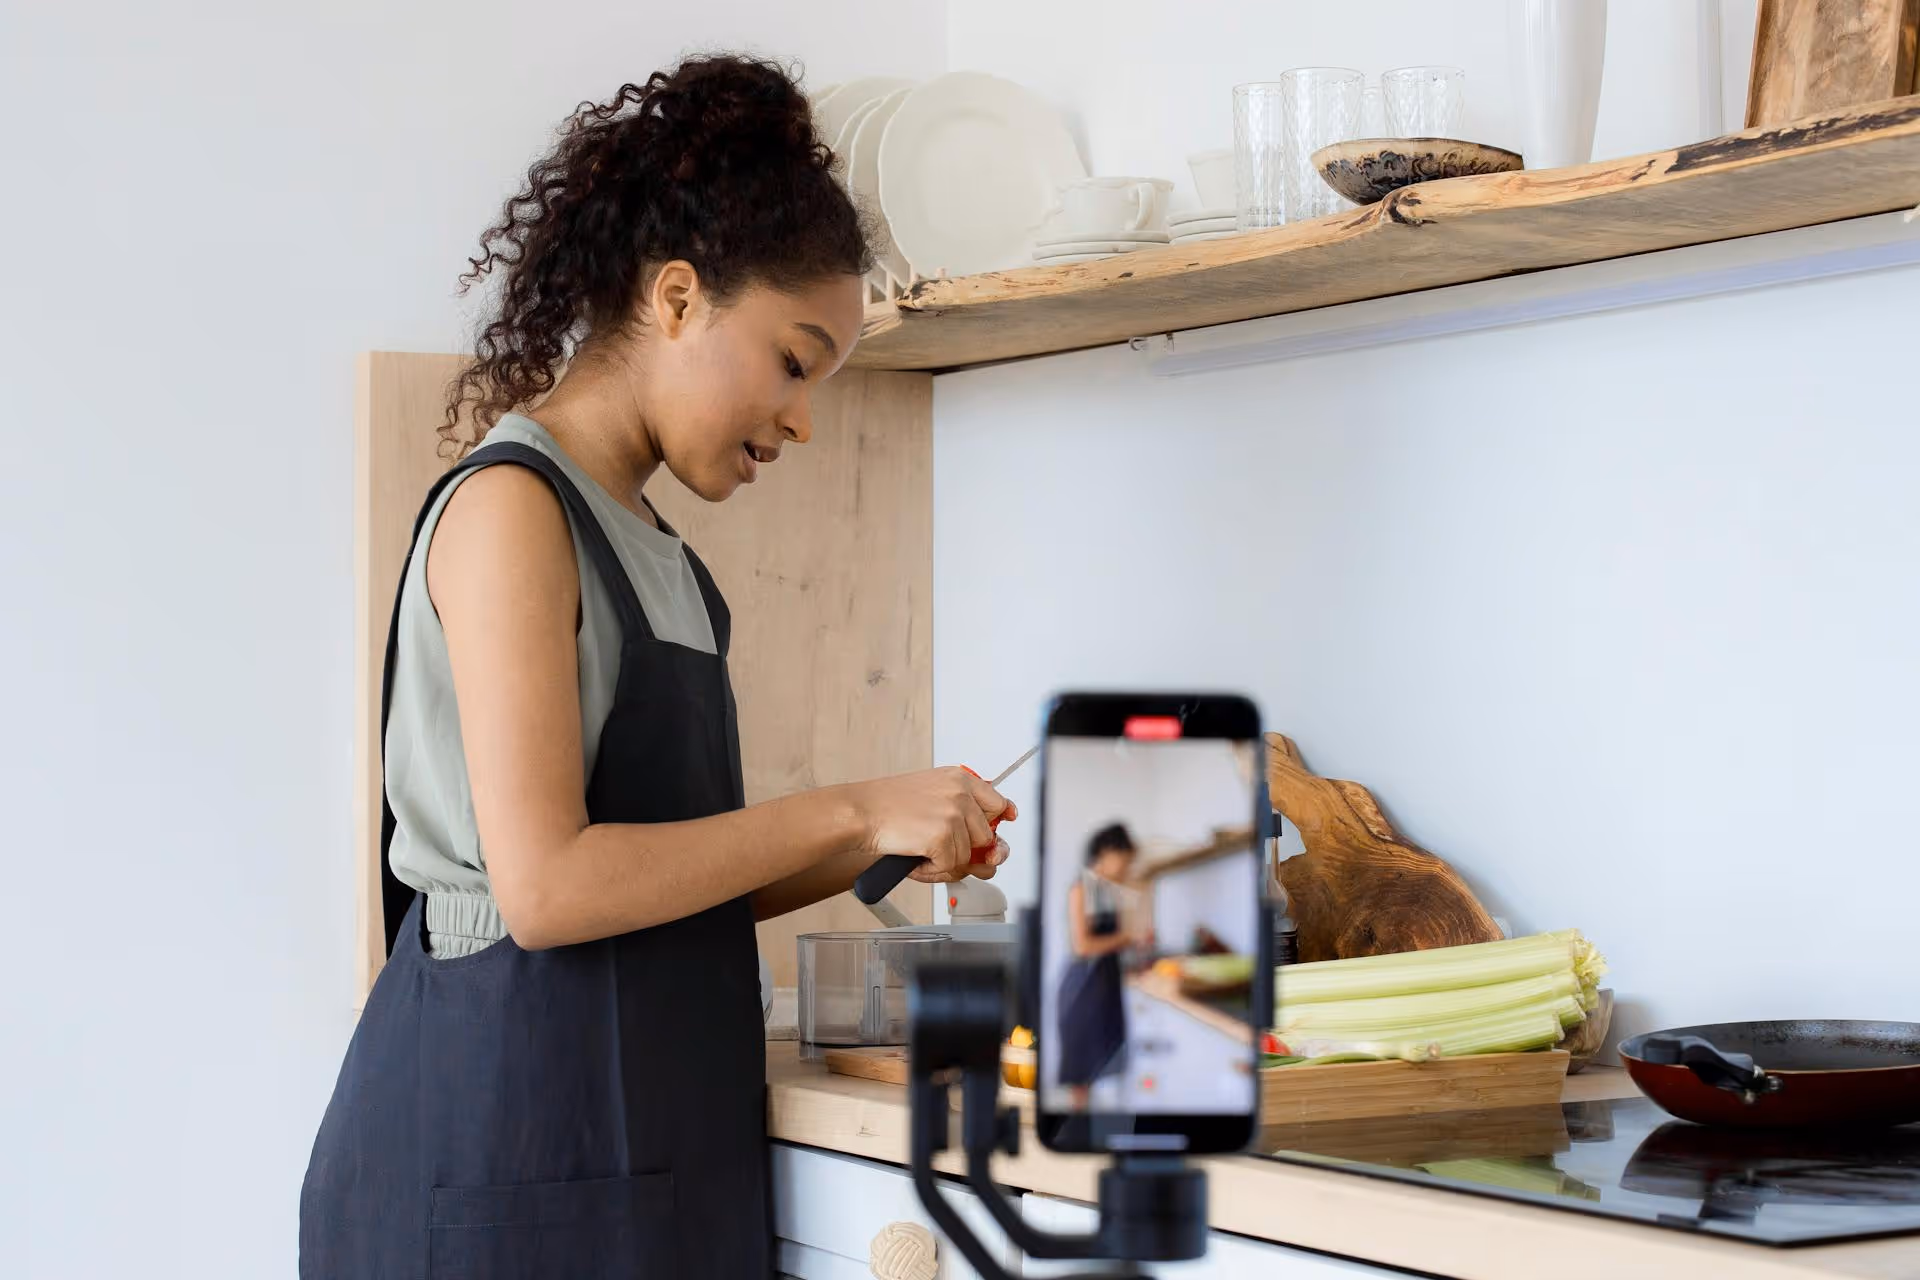
You’re consistently creating and posting TikToks, but now you’re asking the million-dollar question: is any of this actually working? To go from simply posting content to building a real audience, you need to know how to check your TikTok stats. This guide breaks down exactly where to find your analytics, what each metric actually means, and how to use that data to create videos that connect with viewers and fuel your growth.
Before you can get access to any performance data, you need to switch your TikTok profile to a Business Account. Don't worry, this is completely free, only takes about 30 seconds, and won't change how you use the app. It simply unlocks the professional tools you need, including the ever-important analytics dashboard. A personal account is for watching, a business account is for creating and growing.
Here’s how to make the switch:
Once you’ve switched, new data will start populating. It’s not retroactive, so give it a day or two to start gathering insights for you.
With a Business Account set up, your analytics are now just a few taps away. You can view them on your phone for a quick glance or on a desktop for a more detailed analysis.
This is the most common way to check your stats and is perfect for seeing how a recent video is performing on the go.
This will drop you right into your analytics dashboard, organized into four main tabs: Overview, Content, Followers, and LIVE.
Analyzing a bunch of numbers on a tiny screen can be tough. The desktop view gives you more space to see charts and data, making it easier to spot trends.
The desktop view presents the same information as the mobile app but in a more expansive layout that’s ideal for weekly or monthly reporting.
Your TikTok analytics are split into four sections, each giving you a different piece of the performance puzzle. Let’s break down what you'll find in each one and how to interpret it.
This is your home base for high-level stats. It gives you a bird's-eye view of your account’s overall performance during a selected time frame. You can choose to see data for the last 7, 28, or 60 days, or you can set a custom date range.
Here are the key metrics at a glance:
This is where things get really interesting. The Content tab shows you how your individual videos are performing, allowing you to see exactly what style, topic, or format is resonating most with your audience.
You’ll see a section for Video Posts that highlights your top performing videos over the last 7 days. These are the videos you should be studying. Why did they work? Was it the hook? The sound? The topic? This is how you find patterns to repeat.
You can get an even deeper look by tapping on any video from the Content tab (or directly on a video from your profile and hitting "More data"). These individual metrics are where you’ll find gold.
You can’t create content your audience will love if you don’t know who they are. The Followers tab gives you a direct look into your community’s demographics and behavior.
If you use TikTok LIVE to engage with your audience, this tab provides analytics related to those sessions. The data here won't populate unless you have gone live recently.
Here, you'll find metrics like:
Checking these stats can help you understand what kinds of LIVE content are most effective at attracting viewers and driving engagement.
Looking at your TikTok stats isn't about chasing vanity metrics. It's about learning a new language that tells you exactly what your audience enjoys. By regularly monitoring the data in your Overview, Content, and Followers tabs, you can get out of the guessing game and start making strategic, data-driven decisions that will consistently lead to better content and more sustainable growth on the platform.
Of course, once you start tracking all these numbers and identifying trends, you'll need an easy way to plan and schedule your content based on what you’ve learned. At Postbase, we built our platform from the ground up to support creators in today’s short-form video world. Our clean, visual calendar helps you plan content around your audience’s peak activity times, while our unified analytics dashboard lets you see your TikTok performance alongside all your other social platforms, giving you one clear view of what’s truly working so you can achieve your goals faster.
Spencer's spent a decade building products at companies like Buffer, UserTesting, and Bump Health. He's spent years in the weeds of social media management—scheduling posts, analyzing performance, coordinating teams. At Postbase, he's building tools to automate the busywork so you can focus on creating great content.

Enhance your email signature by adding social media icons. Discover step-by-step instructions to turn every email into a powerful marketing tool.
Record clear audio for Instagram Reels with this guide. Learn actionable steps to create professional-sounding audio, using just your phone or upgraded gear.
Check your Instagram profile interactions to see what your audience loves. Discover where to find these insights and use them to make smarter content decisions.
Requesting an Instagram username? Learn strategies from trademark claims to negotiation for securing your ideal handle. Get the steps to boost your brand today!
Attract your ideal audience on Instagram with our guide. Discover steps to define, find, and engage followers who buy and believe in your brand.
Activate Instagram Insights to boost your content strategy. Learn how to turn it on, what to analyze, and use data to grow your account effectively.
Wrestling with social media? It doesn’t have to be this hard. Plan your content, schedule posts, respond to comments, and analyze performance — all in one simple, easy-to-use tool.

